Knowledge Graph의 SCM 적용

 Enzo
Enzo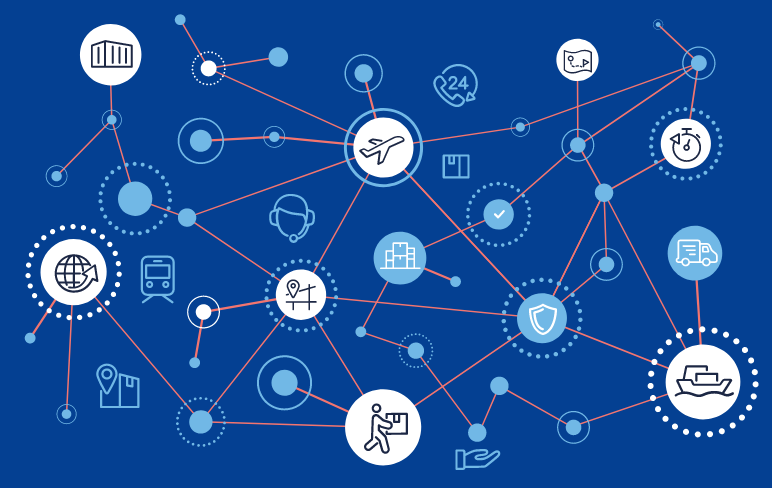
민첩하고 탄력적인 공급망을 구축하는 데 있어, 세상이 어떻게 돌아가고 있든 상관없이 모든 사람들은 빠른 처리와 신속한 배송을 기대합니다. 이러한 기대를 충족하지 못하면 회사의 수익성과 평판에 타격을 입게 됩니다.
하지만 좋은 소식이 있습니다. 그래프 기술과 예측 분석을 활용하면 공급망 예측에서 발생할 수 있는 병목 현상을 극복할 수 있습니다. 이러한 기술 역량을 전략적으로 적용하면 데이터를 통해 숨겨진 관계를 밝혀내고, 상황이 변화하더라도 가장 효율적인 경로에 대한 예측을 할 수 있습니다.
toggle
When it comes to building agile, resilient supply chains, everyone expects fast turnarounds and quick delivery, regardless of what’s happening in the world. If you don’t meet those expectations, your company’s bottom line and reputation suffer.
The good news? You can overcome potential bottlenecks in supply chain forecasting by using graph technology and predictive analytics. By applying these technical capabilities in a strategic manner, you can uncover hidden relationships in your data to make predictions about the most efficient path forward – even as circumstances shift.
공급망 병목 현상의 높은 비용과 이를 방지하는 방법 (The High Cost of Supply Chain Bottlenecks and How to Avoid Them)
2022년 D사의 설문조사에 따르면, 제조업 임원 중 80%가 지난 12~18개월 동안 심각한 공급망 중단을 경험했다고 보고했습니다. 다음은 공급망을 정지시키는 병목 현상의 몇 가지 예시입니다.
- 부품 부족
- 제조 공정의 문제
- 노동자 파업
- 항구의 교통 혼잡
- 기상 재해
이러한 지연은 비용이 많이 듭니다. 대형 컨테이너선이 수에즈 운하에 좌초되었을 때, 매일 약 90억 달러 상당의 상품 흐름이 방해된 것으로 추산되었습니다.
불행히도, 공급망이 방대하고 복잡할수록 병목 현상이 발생할 가능성도 커집니다. 탄력적이고 민첩한 네트워크를 구축하려면 이러한 병목 현상이 어디에 있는지를 이해하는 것만으로는 충분하지 않습니다. 그 근본 원인을 파악하고, 네트워크를 통해 발생하는 파급 효과를 예측하며, 결정의 결과를 예상해야 합니다. 이를 위해서는 공급망의 모든 요소 간의 관계를 분석하고 해석할 수 있는 기술이 필요합니다.
toggle
According to a 2022 Deloitte survey, 80% of manufacturing executives reported significant supply chain disruptions in the previous 12–18 months. This is just a sample of the types of bottlenecks that grind your supply chain to a halt:
- Part shortages
- Manufacturing process breakdowns
- Labor strikes
- Port traffic jams
- Weather disasters
These delays are costly, too. When a large container ship got stuck in the Suez Canal, it was estimated that each day of blockage disrupted $9 billion worth of goods.
Unfortunately, the vast, complex nature of supply chains means more potential for bottlenecks. The key to building a resilient, agile network goes beyond understanding where these bottlenecks lie. You must also pinpoint their root causes, foresee the ripple effects through the network, and anticipate the outcomes of decisions. To do all this, you need technology that lets you analyze and interpret relationships between all the elements in your supply chain.
공급망 예측 개선 방법: 기존 도구를 넘어선 접근 (How to Improve Supply Chain Forecasting: Beyond Legacy Tools)
공급망에 대한 엔드투엔드 가시성이 없다면 병목 현상을 사전에 감지할 수 없습니다.
스프레드시트나 관계형 데이터베이스에 의존할 경우, 다양한 출처에서 수집된 구조화되지 않은 데이터를 연결하는 것은 매우 어렵습니다. 복잡한 데이터 세트에 직면하면 관계형 데이터베이스는 다루기 어려워지고, 효율적이고 민첩한 수요 예측이 불가능해집니다.
공급망 리더들은 공급망 관리에서 더 강력한 예측을 가능하게 하기 위해 데이터 시스템을 전환하고 있습니다. 그 목표는 중단을 예측하고, 완화하며, 아예 피하는 것입니다. 맥킨지 보고서에 따르면 공급망 임원 중 90%가 향후 몇 년 안에 계획 기술을 전면 개편할 것으로 기대하고 있으며, 80%는 이미 AI, 머신 러닝, 데이터 분석을 도입하여 프로세스를 개선하고 이전에는 얻을 수 없었던 인사이트를 발견하고 있습니다.
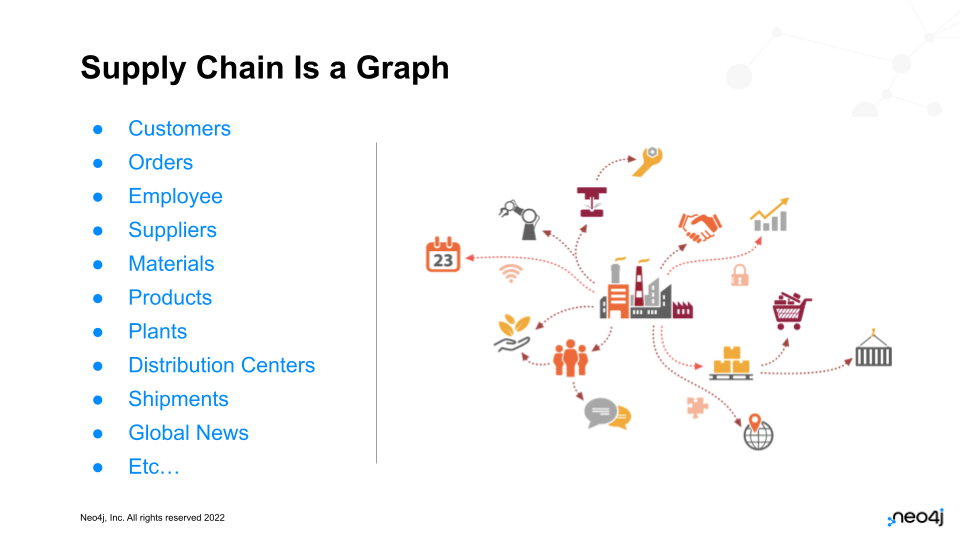
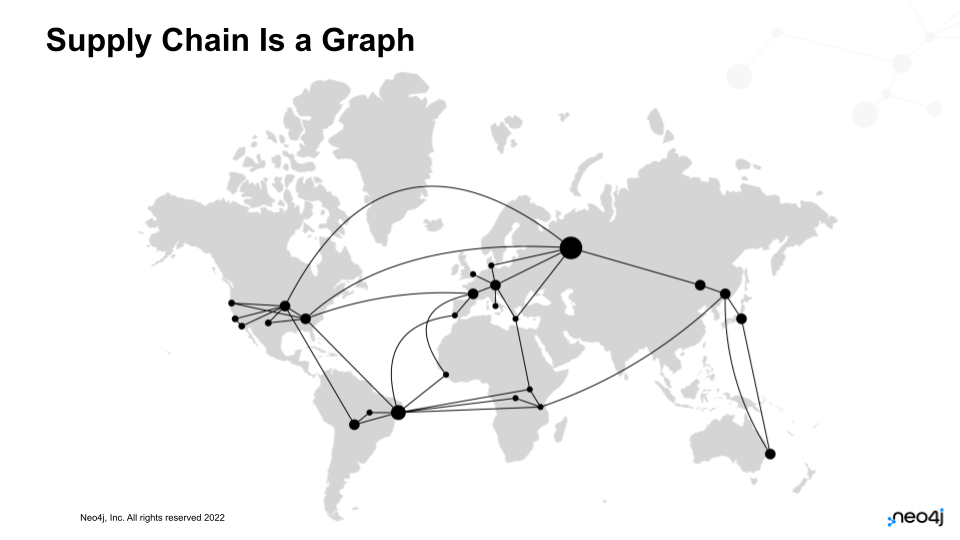
그래프 데이터베이스는 현대 공급망에 대한 엔드투엔드 가시성을 지원하도록 설계되어 있으며, 공급망을 실제 세계에 존재하는 네트워크로 볼 수 있게 해줍니다.
toggle
Unless you have end-to-end visibility into your supply chain, you won’t be able to detect bottlenecks before they happen.
It’s exceptionally hard to map out interconnected, unstructured data from different sources when you rely on spreadsheets or relational databases. Faced with complex datasets, relational databases become clunky and lose fidelity, which prevents efficient, agile demand forecasting in supply chain.
Supply chain leaders are transforming their data systems to enable stronger forecasting in supply chain management, with the goal of predicting, mitigating, and avoiding disruptions altogether. McKinsey reports that 90 percent of supply chain executives expect to overhaul their planning technology within the next few years. 80 percent are already embracing AI, machine learning, and data analytics to improve their processes and discover previously out-of-reach insights.
Graph databases are designed to support end-to-end visibility for the modern supply chain, allowing you to see your supply chain as it exists in the real world: a network of entities.
그래프 데이터베이스로 공급망을 시각화하는 방법 (How to Visualize Your Supply Chain With a Graph Database)
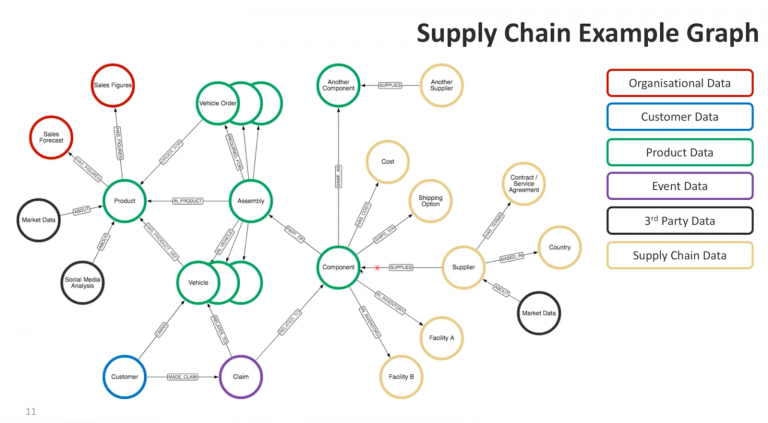
정확한 공급망 예측을 위해서는 데이터베이스가 공급자, 경로, 유통 센터, 제품 등 엔터티(그래프에서 "노드"라고 함) 간의 관계를 포착해야 합니다.
그래프 데이터베이스는 공급망의 이러한 요소들을 명확한 관계를 가진 상호 연결된 데이터 포인트로 매핑할 수 있도록 해줍니다. 그래프 데이터베이스는 스키마가 없기 때문에 다른 공급자나 새로운 제품 카테고리와 같은 새로운 데이터를 쉽게 수용하고 확장할 수 있습니다.
그래프 데이터베이스는 직관적인 공급망 시각화를 제공하는 것 외에도 또 하나의 중요한 이점을 제공합니다: 속도입니다. 행, 열, JOIN 및 유연하지 않은 프레임워크에 구애받지 않는 그래프 데이터베이스는 관계형 데이터베이스보다 100배 빠른 쿼리 응답을 제공합니다. 이는 공급망 내 엔터티 간의 관계가 그래프 데이터베이스에서 일급 시민이 되기 때문입니다. 공급망 예측에서 데이터를 관계 집합으로 다루면 더 정확한 예측을 할 수 있습니다.
toggle
To enable accurate supply chain forecasting, your database should capture the relationships between entities (called “nodes” in a graph) such as suppliers, pathways, distribution centers, products, and so on.
A graph database enables you to map out these elements of your supply chain as interconnected data points with clear relationships. Since graph databases are schema-free, they easily adapt and expand to incorporate new data, whether that’s from another supplier or a new product category.
Besides providing an intuitive visualization of your supply chain, graph databases offer another much-needed benefit: speed. Unburdened by rows, columns, JOINs, and inflexible frameworks, graph databases can deliver 100 times faster query responses than relational databases. That’s because the relationships between entities in your supply chain become first-class citizens in a graph database. For supply chain forecasting, working with your data as a set of relationships allows you to make more accurate predictions.
공급망 최적화를 위한 가장 인기 있는 4가지 그래프 알고리즘 (4 Most Popular Graph Algorithms for Supply Chain Optimization)
공급망 데이터를 그래프 데이터베이스에 저장하면 알고리즘을 적용하여 공급망 예측 분석을 수행하고 인사이트를 추출하는 것이 간단해집니다. 부품 부족과 같은 상황에 대응하기 위해 경로를 재설정하거나 더 짧은 경로를 생성해야 할 때, 공급망의 경로를 실시간으로 탐색할 수 있습니다.
공급망 예측 분석의 주요 예시는 무엇일까요? 이 용례에 사용할 수 있는 4가지 주요 알고리즘 카테고리가 있습니다. (Neo4j Graph Data Science에는 모델을 개선하는 데 도움이 되는 65개 이상의 예측 분석 및 ML 알고리즘이 포함되어 있습니다.)
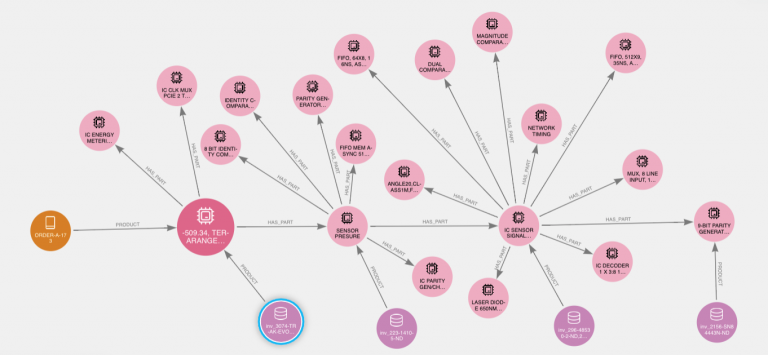
- 경로 찾기 및 검색 알고리즘
경로 찾기 알고리즘은 노드 간의 경로를 찾아 평가합니다. 보스턴 사이언티픽은 Shortest Path 알고리즘을 사용하여 결함이 있는 부품 간의 연결을 찾아냅니다. 다른 조직들은 이러한 알고리즘을 사용하여 원자재와 최종 제품 사이의 최적 경로 또는 공장과 유통 센터 사이의 최단 경로를 찾습니다. - 중심성 알고리즘
중심성 알고리즘은 공급망에서 가장 중요한 노드를 찾는 데 도움을 줍니다. 예를 들어, 많은 다른 요소와 연결된 한 요소를 찾는 데 유용합니다. 그래프 시각화와 함께 이 알고리즘을 사용하면 중앙 교통 허브와 같은 중대한 병목 현상을 쉽게 확인하고 이를 우회할 수 있습니다.
예를 들어, 2021년에 발생한 오클랜드와 로스앤젤레스 항구의 대규모 병목 현상을 예측하기 위해 공급망 관리자가 중심성 알고리즘을 사용했을 수 있습니다. 그런 경우 비용이 많이 드는 지연을 피하기 위해 육상 공급업체로 전환할 수 있었을 것입니다.
- 커뮤니티 탐지 알고리즘
커뮤니티 탐지 알고리즘은 노드 그룹이 어떻게 클러스터링되거나 분할되는지, 그리고 그들이 분리되거나 강화될 경향이 있는지를 평가합니다. 예를 들어, 부품이나 원자재가 결함이 있거나 오염된 것으로 밝혀지면, 커뮤니티 탐지 알고리즘은 결함이 있는 요소를 포함한 모든 제품을 추적할 수 있습니다. - 유사성 알고리즘
유사성 알고리즘은 데이터 세트에서 속성이나 가까움을 기준으로 노드 간의 유사성을 계산할 수 있게 해줍니다. 이 유형의 알고리즘은 유사한 부품에 대한 대체 공급업체를 찾아야 할 때 유용합니다.
toggle
With your supply chain data stored in a graph database, it’s simple to apply algorithms to conduct supply chain predictive analytics and extract insights. When you need to reroute or create a shorter path to react to situations such as a parts shortfall, you can traverse the paths of your supply chain in real-time.
What are some key examples of predictive analytics in supply chain? There are four main algorithm categories for this use case. (Neo4j Graph Data Science contains 65+ predictive analytics and ML algorithms to help improve your models.)
1. Pathfinding and Search Algorithms
Pathfinding algorithms find and evaluate paths between nodes. Boston Scientific uses the Shortest Path algorithm to uncover links between faulty components. Other organizations use these algorithms to find optimal routes between raw materials and final products or the shortest paths between plants and distribution centers.
2. Centrality Algorithms
Centrality algorithms help you find the most important nodes in your supply chain, such as one element that connects to many others. When you use graph visualization with these algorithms, it’s easy to see potential bottlenecks like a heavy operational load on a central transportation hub – and how to bypass them.
For example, a supply chain manager could have used a centrality algorithm to forecast the massive Oakland and Los Angeles port bottlenecks that occurred in 2021. They then could have switched to on-shore suppliers to avoid costly delays.
3. Community Detection Algorithms
Community detection algorithms evaluate how node groups are clustered or partitioned along with their tendency to break apart or become stronger. For example, if a part or raw material is found to be defective or contaminated, community detection algorithms can trace every product that contains the faulty element.
4. Similarity Algorithms
Similarity algorithms let you calculate similarities between nodes based on properties or closeness in a data set. This type of algorithm is helpful when you need to find alternative suppliers for comparable parts.
실세계 예시: 부품 수요와 비용 예측 (Real-World Example: Anticipating the Demand and Costs for Parts)
미국 육군은 소형 화기에서 항공기에 이르기까지 부품 조달 및 물류를 혁신하기 위해 그래프 기술을 도입했습니다. (규모를 설명하자면, 육군은 한 번에 수백만 개의 부품을 주문하는 경우도 있습니다.) 육군은 교체 부품의 수요를 예측하고 평균 고장 시간을 계산하는 것과 같은 데이터 쿼리를 처리하는 데 어려움을 겪고 있던 노후한 메인프레임 기반 시스템을 사용하고 있었습니다. Neo4j를 사용하여 육군은 이 핵심 추적 시스템을 현대화하였고, 3TB 크기의 데이터베이스에 52억 개 이상의 노드와 141억 개의 관계를 사용하여 방대한 물류 데이터를 빠르게 저장, 탐색 및 시각화할 수 있게 되었습니다. 이제 육군은 예비 부품의 수요를 예측하고 이를 여러 예산 기간에 분산시킵니다. 이는 더 나은 주문 및 예산 관리로 이어지며, 총 소유 비용을 예측 가능하게 만들 뿐만 아니라 장비 가동 중단이나 안전을 저해하지 않습니다.
toggle
The U.S. Army has adopted graph technology to transform its parts procurement and logistics from small arms to aircraft. (To give you an idea of the scale, the Army sometimes orders millions of components at a time.)
The Army had an aging mainframe-based system that needed help managing data queries like forecasting the need for replacement parts and calculating the mean time to failure. With Neo4j, the Army modernized this core tracking system, employing a 3TB database with over 5.2 billion nodes and 14.1 billion relationships to rapidly store, explore, and visualize its wealth of logistical data.
Now, the Army anticipates the demand for spare parts and spreads it across multiple budget time periods. That means better ordering and budgeting, with a more predictable total cost of ownership – and not at the cost of equipment downtime or safety.
그래프의 가치 (The Value of Graph)
어떤 핵심 비즈니스 역할에서든 – CIO, CTO, 데이터 과학 디렉터, 공급망 리더, 혹은 리드 개발자 등 – 새로운 기술에 투자할 때는 경험적 증거가 필수적입니다.
Forrester Consulting은 지난 20년 동안 사용되어 온 업계 표준 프레임워크인 Neo4j에 대한 총 경제적 영향(TEI) 평가를 수행했습니다. 이 방법은 비용, 혜택, 유연성 및 위험을 분석하여 제품의 투자 수익률(ROI)에 대한 정보에 기반한 예측을 제공합니다.
이 의뢰된 연구는 고객 배포 전반에 걸쳐 그래프 기술을 사용함으로써 얻을 수 있는 평균 가치를 계산했습니다. 연구 결과, 복합 조직은 Neo4j를 사용함으로써 3년 동안 초기 투자 비용의 4배 이상을 회수할 수 있으며, 417%의 투자 수익률을 기대할 수 있는 것으로 나타났습니다.
toggle
In any key business role – be it CIO, CTO, Director of Data Science, supply chain leader, or lead developer – it’s imperative to have empirical evidence when investing in a new technology.
Forrester Consulting conducted a Total Economic Impact™ assessment of Neo4j, an industry-standard framework that’s been used for the last 20 years. This method examines costs, benefits, flexibility, and risks to provide an informed projection of the product’s return on investment.
This commissioned study calculated the average value of using graph technology across customer deployments. It found that a composite organization could expect Neo4j to pay for itself more than 4x in the span of three years, delivering a 417 percent return on investment (ROI).