지식 그래프: 이론과 응용 심층 탐구

 Akash Das
소개 (Introduction)
이야기를 하나 들려드리겠습니다. 몇 년 전, 국제 탐사보도 언론인 협회(ICIJ)의 데이터 팀이 오늘날 우리가 파나마 페이퍼스라고 부르는 대규모 데이터를 받았을 때, 그들은 아마도 그것이 무의미한 작업일 것이라고 생각했을 것입니다. 파나마 페이퍼스는 1,150만 개 이상의 금융 및 법률 기록이 포함된 거대한 유출로, 비밀스러운 해외 회사에 의해 감춰진 범죄, 부패, 그리고 비리를 드러냅니다. 2015년부터 우리가 뉴스에서 읽어온 해외 금융 스캔들은 ICIJ 팀이 지식 그래프(Knowledge Graph, KG)의 힘을 활용하여 데이터를 문맥화하고 연결한 결과였습니다. 복잡하고 다년간의 멀티미디어 데이터를 지식 그래프에서 연결하여 조사관들이 가장 큰 스캔들 중 일부를 풀어나갈 수 있도록 했습니다.
이제 우리는 지식 그래프(KG)의 개념에 대해 익숙해졌으니, KG를 사용하는 이유, 어디서 사용할 수 있는지, 그리고 어떻게 사용할 수 있는지에 대한 자세한 설명을 드리겠습니다. 즉, 이 기사에서는 지식 그래프와 이를 구현하는 방법에 대해 다루게 될 것입니다.
Toggle
Let me share a story with you. Years back, when the data team of the International Consortium of Investigative Journalists (ICIJ) received a dump of data that today we know as the Panama Papers, they would probably have thought it to be a futile endeavor. With that massive amount of coama Papers is a “giant leak of more than 11.5 million financial and legal records exposes a system that enables crime, corruption, and wrongdoing, hidden by secretive offshore companies.” The rouge offshore financial scandals that we have been reading about in the news since 2015 were the efforts of the team of ICIJ to leverage the power of knowledge graphs (KG) that gave context and connection to the data. The complex, multi-year multimedia data in Knowledge Graphs were linked so investigators could walk through the connections to unravel some of the biggest scandals of the past.
Now that we are familiar with tleave you with a detailed unconcepts behind KGs, why, where, and how we can use KGs. So, Basically in this article you will get to know about the knowledge graph and how to implement it, so We are Covering Knowledge Graph nad What is Knowledge graph their application.
학습 목표 (Learning Objectives)
이 기사의 학습 목표는 지식 그래프라는 기술을 사용하여 데이터를 더 지능적이고 스마트하게 만드는 것입니다. 지식 그래프는 다른 일반적인 그래프보다 더 높은 평가를 받는데, 그 이유는 조직화 기술이 추가되었기 때문입니다. 또한 이 글은 실세계에서 지식 그래프를 찾고, 이를 구축하는 방법을 탐구합니다.
This article was published as a part of the Data Science Blogathon.
Toggle
This article’s learning goal is to make our data more intelligent and smart using a technique called Knowledge Graphs. KGs score brownie points over the rest of the normal graphs because of the addition of organizing techniques. The article also explores how to find knowledge graphs in the real world and help you build one.
지식 그래프란?
지식 그래프는 그래프 기반 데이터 모델을 사용하여 지식을 구조적으로 표현한 것입니다. 노드와 간선으로 정보를 구성하며, 노드는 엔티티나 개념을 나타내고, 간선은 그들 간의 관계를 나타냅니다. 지식 그래프는 서로 연결된 지식의 효율적인 저장, 검색, 추론을 가능하게 하여 고급 검색, 분석, 추론 작업을 촉진합니다.
많은 사람들이 알고 있듯이 컴퓨팅에서 그래프는 복잡한 알고리즘과 데이터 과학 및 컴퓨팅을 지원하는 유연하고 편리한 데이터 모델링 방법입니다. 하지만 지식 그래프가 일반적인 그래프와 다른 점은 사람들이나 소프트웨어가 이를 빠르게 해석할 수 있도록 돕는 조직 원칙이 적용된다는 점입니다. 즉, 응용 프로그램에 지능적인 동작을 반복적으로 인코딩하는 대신, 데이터를 한 번에 인코딩합니다! 지식 그래프는 수십 년에 걸친 의미론적 컴퓨팅 연구의 결과이지만, 현대 그래프 컴퓨팅의 발전으로 실세계 문제에 쉽게 적용할 수 있게 되었습니다.
따라서 지식 그래프는 현실 세계의 엔티티와 그들 간의 관계를 나타내는 구조화된 지식 베이스라고 할 수 있습니다. 대부분의 지식 그래프는 Subject-Predicate-Object(SPO) 형식으로 지식을 저장하며, 이는 RDF(Resource Description Framework) 표준과 일치합니다. 특정 SPO 삼중항의 존재는 해당 삼중항이 특정 유형의 관계를 가졌음을 나타냅니다. 예를 들어 다음과 같은 지식을 고려해봅시다.
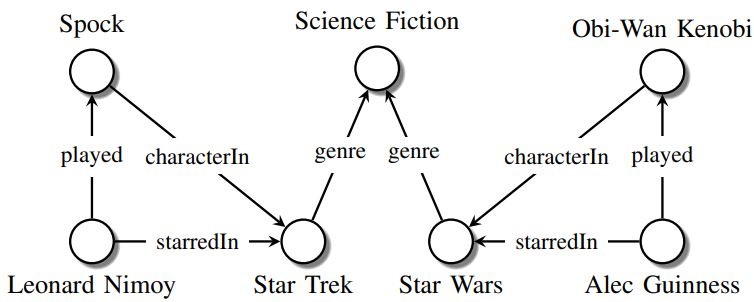
"레너드 니모이는 스타 트렉이라는 공상과학 영화에서 스팍 캐릭터를 연기한 배우입니다."
다음은 해당 지식을 도식적으로 나타낸 샘플 지식 그래프입니다. 여기서 노드는 엔티티를 나타내고, 간선 레이블은 관계 유형을 나타내며, 간선 자체는 기존의 관계를 나타냅니다.
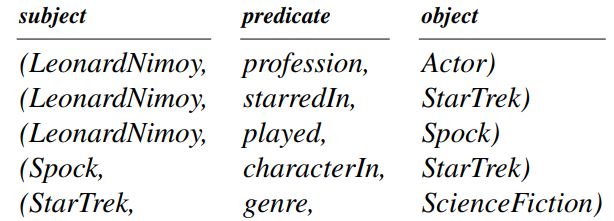
제시된 지식에서 추출된 SPO 삼중항은 아래와 같습니다:
이제 우리는 지식 그래프의 구조를 이해했습니다. 다음으로는 지식 그래프의 본질을 드러내고 일반적인 그래프와 차별화하는 조직 원칙에 대해 살펴보겠습니다.
toggle
A knowledge graph is a structured representation of knowledge that uses a graph-based data model. It organizes information into nodes and edges, where nodes represent entities or concepts, and edges denote relationships between them. Knowledge graphs enable efficient storage, retrieval, and inference of interconnected knowledge, facilitating advanced search, analysis, and reasoning tasks.
Most of us know that graphs in the computation are a pleasant and flexible way of data modeling that supports various complex algorithms and data science and computation. But what differentiates KGs from graphs is the application of an organizing principle that helps humans and software to interpret it quickly. So rather than repeatedly encoding intelligent behavior into applications, we directly encode it into the data once and for all! KGs results from decades of research into semantic computation, but with the advent of modern graph computations, they can be easily extended into real-world problems.
Thus we can say the KGs are structured knowledge bases that represent real-world entities and the relationships between them. Most KGs store this knowledge in triplets known as Subject-Predicate-Object (SPO) format, which aligns with the Resource Description Framework (RDF) standards. The existence of a particular SPO triplet indicates that the respective triplets possess a relationship of a specific type. For example, consider the following knowledge.
“Leonard Nimoy was an actor who played the character Spock in the science-fiction movie Star Trek.”
A sample knowledge graph of the following is shown in the figure below. Here the nodes represent entities, the edge labels represent types of relations, and the edges themselves represent existing relationships.
While the SPO triplets that can be extracted from the given knowledge are shown below:
Now we understand the structure of KGs. Next, we would look into the organizing principles of KGs, which bring out their essence and differentiate it from typical graphs.
지식 그래프의 조직 원칙 (Organizing Principles of a Knowledge Graph)
그래프에서 데이터를 조직하는 여러 가지 방법이 있으며, 각 방법에는 장단점이 있습니다. 이 섹션에서는 각 조직 계층을 논의할 것입니다. 간단한 그래프부터 시작하여 점진적으로 조직 계층을 추가하는 방식이 데이터를 더 스마트하고 해석 가능하게 만들며, 점점 더 복잡한 문제를 해결하는 데 어떻게 도움이 되는지 설명하겠습니다.
toggle
There are several ways to organize data in graphs, each with advantages and drawbacks. In this section, we will be discussing each of the organizing hierarchies. We would start with plain simple graphs and try to explain how adding successive layers of organization helps make the data smart and more interpretable, thereby helping solve increasingly sophisticated problems.
일반적인 그래프 (Plain Old Graphs)
이것은 조직 원칙이 적용되지 않은 그래프입니다. 하지만 이러한 그래프가 우리의 일상적인 도전 과제를 해결하는 데 도움이 된다는 것을 알고 있습니다. 이러한 그래프들은 몇 가지 중요한 시스템의 기반을 이루고 있습니다. 데이터를 조직하는 원칙을 데이터에 연관시키는 대신, 이러한 그래프 데이터를 사용하는 프로그램과 시스템에 조직 원칙이 내장되어 있습니다.
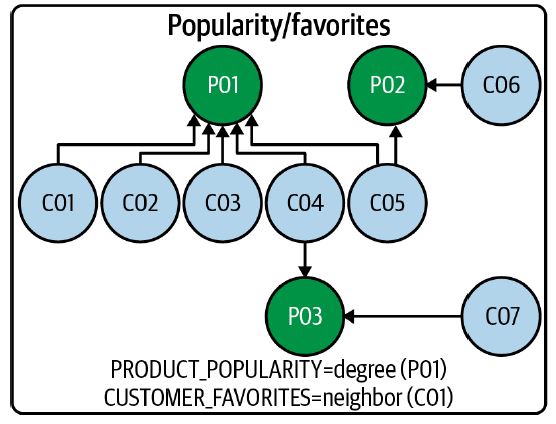
일반적인 예로는 온라인 스토어의 판매가 있을 수 있습니다. 아래 그림은 고객과 그들의 구매 내역을 평범한 그래프로 보여주는 판매 및 제품 카탈로그의 일부분입니다.
그래프를 바로 보면 직관적이지 않을 수 있지만, P 노드가 제품을 나타내고, C 노드가 고객을 나타내며, 노드 간의 연결이 구매를 나타낸다는 지식을 프로그램에 인코딩하면 특정 고객이 구매한 제품이나 제품의 인기를 계산하는 등의 질문에 쉽게 답할 수 있습니다. 이러한 종류의 그래프 정보는 유용하며 데이터를 간단히 제공하는 데 도움이 되지만, 도메인에 대한 사전 지식이 없는 데이터 과학자가 코드를 테스트할 때는 데이터를 읽는 방법을 설명해 주거나, 데이터를 해석하는 방법을 이해하기 위해 코드를 역공학해야 할 수도 있습니다.
따라서 그래프에 일부 조직 원칙을 적용하여 데이터를 더 스마트하게 만드는 것이 더 나은 해결책입니다. 이 과정은 다음 세 가지 하위 섹션에서 살펴보겠습니다.
toggle
These are graphs that haven’t had any organizing principle applied to them. Still, we know that they help solve our daily challenges as they underpin some very important systems. Instead of associating the “organizing principles”‘ with the data, the programs and systems that consume these graph data are embedded with the “organizing principles.”
A typical example of the same would be the sales of an online store. The figure below shows a small portion of the sales and product catalog graph, showing the customers and their purchases in the form of a plain old graph.
Looking straight into the graph might not be intuitive. Still, when the knowledge that P nodes represent products, C nodes represent customers, and the connections between the nodes represent purchases are encoded into the program, it would be easy to answer questions like products that a particular customer bought and vice versa or computing the popularity of the product. There is no doubt to the fact that these kind of graph information are helpful and does help compactly provide data, but in cases when data scientists with no prior knowledge of the domain try to dry run the code, then either someone will have to explain how to read the data, or he might have to reverse engineer the codes to understand how to interpret the data. Thus a better solution is to make the data smart by applying some organizing principles to the graphs, which we will see in the following three subsections.
더 풍부한 그래프 모델 (Richer Graph Models)
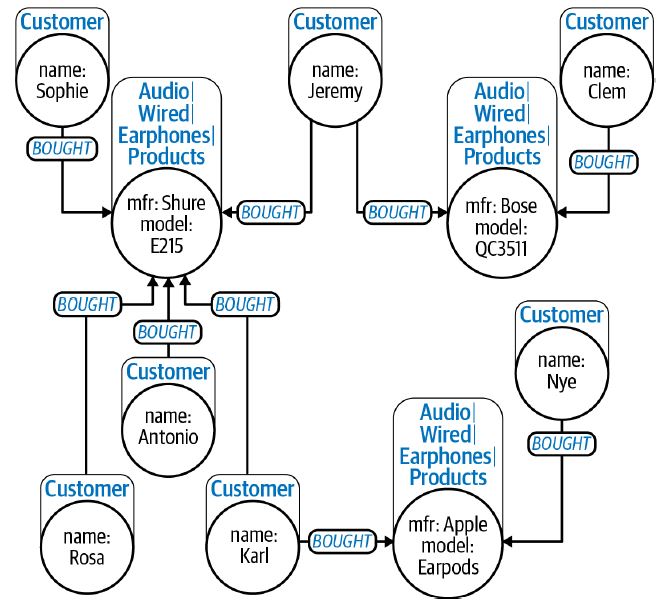
첫 번째 조직 원칙은 속성 그래프 모델입니다. 이는 더 풍부하고 더 많이 조직된 방식으로, 레이블이 있는 노드, 관계 유형, 방향 및 노드에서 속성(키-값 쌍)을 지원합니다. 이렇게 하면 그래프가 어느 정도 자가 설명적이 되어 데이터를 더 스마트하게 만드는 명백한 단계로 나아갈 수 있습니다! 또한 속성 그래프 모델의 기능을 활용하여 도메인 지식 없이도 일부 전처리와 시각화를 수행할 수 있습니다.
위 그림은 레이블, 속성, 명명된 관계를 포함한 판매 및 제품 카탈로그의 강화된 뷰를 보여줍니다.
toggle
The first organizing principle that we would see is the property graph model. It is richer and far more organized and supports labeled nodes, types, and directions of relationships and properties (key-value pairs) on both nodes. Thus it can provide humans and machines with some essential clues about the information it contains. Thus this organizing style makes the graph self-descriptive to a certain level and is a clear step towards making the data smarter! Also, some preprocessing and visualizations can be carried out without any domain knowledge just by leveraging the features of property graph models.
The figure above shows an enriched view of sales and product catalogs, which include labels, properties, and named relationships.
계층 구조를 위한 분류 체계를 사용하는 지식 그래프 (KGs Using Taxonomies for Hierarchy)
위에서 보았듯이 노드를 레이블로 분류하는 것이 유용하다는 것을 알 수 있습니다. 그러나 더 깊이 생각해 보면 레이블 간의 연결이 누락되었음을 깨달을 수 있습니다!
판매 제품 카탈로그를 계속해서, 특정 제품이 재고가 없더라도 비슷한 제품을 제안하여 판매를 유도할 수 있는 방식으로 제품 분류를 강화하는 것이 좋습니다. 이를 위해서는 "x는 y의 일종이다"와 같은 추론을 지원하는 분류 체계가 필요합니다.
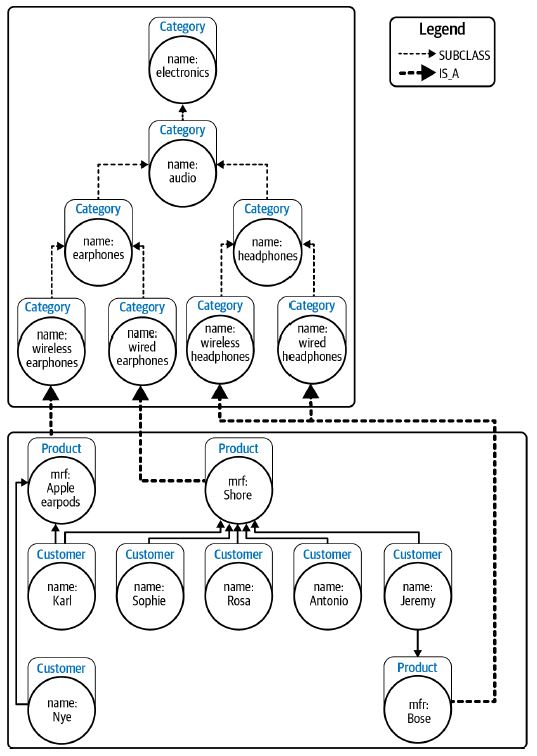
분류 체계는 유사한 속성을 공유하는 항목을 같은 범주로 그룹화하고, 이러한 범주를 전역적으로 관련시킵니다. 이러한 종류의 계층 구조는 제품과 같은 구체적인 항목을 아래에 배치하고, 브랜드 및 제품과 같은 일반적인 항목을 계층의 상단에 배치합니다. 이 종류의 "조직 원칙"에서는 하위 범주 관계로 연결된 범주 노드로 구성된 계층 구조를 구성합니다. 그리고 제품은 판매를 위해 준비된 분류 체계의 적절한 부분에 연결됩니다.
위 그림은 고객 및 판매 데이터 위에 계층 구조를 중첩한 제품 카탈로그 계층 구조를 보여줍니다. 이를 통해 데이터를 더 체계적으로 시각화할 수 있습니다. 더욱 흥미로운 사실은 여러 계층적 조직을 동시에 제공하여 데이터에 대한 더 많은 통찰력을 제공할 수 있다는 점입니다.
toggle
In the above “organizing principle,” we saw that creating categories of nodes using labels is evidently useful. Still, on deeper thought, it may be realized that the associativity between the labels is missing!
Continuing our sales product catalog, a good way to proceed would be to enrich the product classification with some “higher order organizing principle”, so that even if the shopkeeper is out of stock with a particular product, he might be able to win a sale by suggesting some similar product. We need a taxonomy to support this kind of “x is a kind of y” reasoning.
Taxonomy is a classification scheme that allows a broader-narrower hierarchy. Items sharing similar properties are grouped in the same category, and the taxonomy helps relate one category to other globally. This kind of hierarchy allows positioning specific things like products at the bottom, and more general things like brands and products are placed towards the top of the hierarchy. The hierarchy in this type of “organizing principle” is constructed with category nodes connected by subcategory_of relationships. And the products are connected to the appropriate part of the taxonomy to classify them as ready for sale. The same is shown in the figure below.
The figure above shows the product catalog hierarchy layered on top of customer and sales data. This enables a more organized visualization of the data. An even more interesting fact is that we can provide multiple hierarchical organizations simultaneously to help provide even more insight into the data.
다단계 관계를 위한 온톨로지를 사용하는 지식 그래프 (Knowledge Graphs Using Ontologies for Multilevel Relationships)
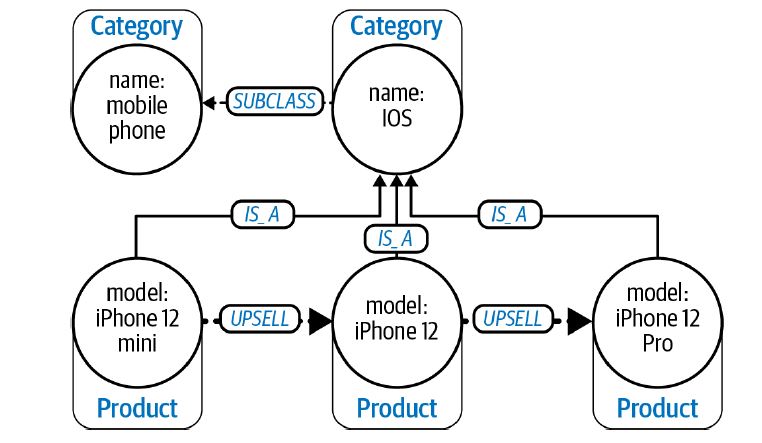
분류 체계는 하위 범주 관계를 통해 조직하는 데 도움이 됩니다. 온톨로지는 부분 관계(part_of), 호환 관계(compatible_with), 종속 관계(depends_on) 등 더 복잡한 관계를 정의할 수 있습니다. 이를 통해 계층적으로(수직으로) 범주를 탐색할 수 있을 뿐만 아니라 수평 비교도 가능합니다. 또한 온톨로지는 모듈 방식으로 구축되어 레이어링을 통해 더 압축적이고 정교하게 만들 수 있습니다. 이렇게 해서 온톨로지는 지식을 실행 가능하게 만듭니다. 아래 그림은 한 카테고리의 제품에 대한 업그레이드 경로를 나타내는 온톨로지 표현입니다.
지금까지 우리는 KG의 다양한 조직 원칙을 살펴보았습니다. 그러나 선택할 조직 원칙은 항상 의도한 사용 목적에 의해 결정되어야 합니다. 관련 프로세스나 에이전트가 사용하지 않을 경우, 복잡하고 풍부한 기능을 조직 원칙에 과도하게 구축하지 않는 것이 좋습니다. 지나치게 야심찬 조직 원칙을 선택하는 것은 자원과 시간 측면에서 비용이 많이 드는 일반적인 실수입니다.
toggle
Taxonomies help organize by bringing in the subcategory_of relations; Ontology allows define more complex relationships between categories like part_of, compatible_with, and depends_on. Thus following the ontological instructions, we can not only explore the categories vertically (hierarchically), but it also allows for horizontal comparison. Besides this, they can be built in a modular fashion to make them more compact with sophisticated use of layering. Thus ontology helps make knowledge actionable. The figure below is an ontological representation showing the upgrade paths for products in a category.
Thus till now, we have seen different types of organizing principles of KG. However, the organizing principle we choose to use should always be driven by its intended usage. It is advisable not to build rich and overcomplicated features into the organizing principles if no associate processes or agents would use them. It is a common mistake to opt for an overly ambitious organizing principle as it would be costly in terms of resources and time.
지식 그래프를 구현하는 방법 (How to Implement Knowledge Graphs?)
이제 지식 그래프(KG)와 다양한 조직 원칙을 이해했으니, 다음 질문은 이를 어떻게 구현할 수 있는가입니다. KG를 구현하는 일반적인 단계는 다음과 같습니다.
1. 데이터 수집
첫 번째 단계는 구조화된 데이터베이스, 비구조화된 데이터베이스 또는 텍스트, 이미지 및 비디오와 같은 멀티미디어 데이터에서 데이터를 수집하는 것입니다.
2. 수집된 데이터 전처리
다음 단계는 데이터에서 불필요하고 중복된 정보를 제거하여 KG를 구축하는 데 사용할 수 있는 형식으로 데이터를 준비하는 것입니다.
3. 엔티티 및 관계 추출
세 번째 단계는 데이터에서 엔티티와 관계를 추출하는 것입니다. 이를 위해서는 명명된 엔티티 인식(NER), 관계 추출, 객체 탐지 등이 필요할 수 있습니다.
4. 지식 그래프 구축
엔티티와 관계를 추출한 후, 다음 단계는 지식 그래프를 구축하는 것입니다. 이 작업은 Neo4j 또는 Titan과 같은 그래프 데이터베이스를 통해 수행할 수 있습니다.
5. 추출된 엔티티와 관계로 KG 채우기
그 후 추출된 엔티티와 관계로 KG를 채우는 작업을 진행합니다.
6. 지식 활용
KG가 구축된 후에는 이를 쿼리하여 유용한 정보를 얻을 수 있습니다.
7. 정확성과 관련성 유지
마지막으로, KG는 정기적으로 유지 관리되고 새로운 데이터로 업데이트되며, 오류가 있는지 모니터링되어야 합니다.
이러한 단계는 특정 사용 사례와 기술에 따라 달라질 수 있으며, 위의 단계들이 명확히 구분된 것이 아닐 수 있습니다. 또한 OpenAI, GPT-3, Google Tensor와 같은 라이브러리 및 프레임워크가 이러한 단계를 지원할 수 있습니다.
toggle
Now that we have understood KGs and the different organizing principles, the next question is how to implement them. Implementing KGs typically involves the following steps:
- Data CollectionThe first step is collecting data from structured/ unstructured databases or text or multimedia data from images and videos.
- Pre-Process the Collected DataThe next step would be to pre-process it to remove irrelevant and redundant information to ensure that data is in a format that can be readily utilized for building the KGs
- Extract Entities and RelationshipsThe third step is to extract the entities and relationships from the data. Named Entity Recognition, relationship extraction, and object detection can achieve this.
- Construct Knowledge GraphOnce the entities and relationships have been extracted, the next step is constructing the knowledge graphs. Graph databases like Neo4j or Titan can achieve this.
- Populate KG with Extracted Entities and RelationshipsThen, follow it by populating the KG with extracted entities and relationships.
- Unlocking KnowledgeOnce KG has been constructed, it can be queried to achieve useful information.
- Ensuring Accuracy and Relevance:Finally, the KG should be regularly maintained, updated with new data, and monitored for errors.
It is noteworthy to mention that these steps are not discrete and may vary depending on the specific use case and technology. Additionally, libraries and frameworks like OpenAI, GPT 3, and Google’s Tensor can help with the steps.
실세계에서 지식 그래프를 어디에서 찾을 수 있을까요? (Where would you Find Knowledge Graphs in the Real World?)
이제 KG를 구축하는 방법을 알았으니, 실세계에서 이를 찾는 방법을 알아보겠습니다.
사기 탐지
사기 시나리오를 그래픽적으로 시각화하는 것은 지식 그래프의 핵심 기능으로, 금융 컨설턴트가 이질적인 데이터 세트를 고려할 수 있도록 도와줍니다. 기존의 머신러닝 알고리즘이 무시할 수 있는 특성과 변수를 재검토하는 데 도움이 됩니다. 예를 들어, 이전 모델은 이메일 주소를 사기 감지에서 중요한 특징으로 간주하지 않았을 수 있습니다. 하지만 두 명의 고객이 동일한 이메일 주소를 사용하는 경우, 이는 그들이 같은 사람일 가능성을 시사하는 경고 신호가 될 수 있습니다. 이 경우 이메일 주소는 엔티티(고객)와 연결된 다른 고객과의 관계를 나타냅니다.
데이터 거버넌스
금융 회사 내의 여러 부서가 시간이 지남에 따라 새로운 데이터를 생성하면서 발생하는 데이터 차이는 일관성 없는 품질과 조직 전체에서 데이터의 유용성 부족으로 이어집니다. 그래프는 메타데이터를 모델링하고 데이터 요소에 풍부한 설명적 의미를 추가하는 의미론적 계층 역할을 합니다. 결합된 메타데이터와 관계는 데이터의 의미를 완전히 설명하며, 데이터를 세부적으로 시각화할 수 있게 합니다. 데이터를 시각화함으로써 지식 그래프는 사용자가 중복되거나 일관성이 없는 데이터를 식별할 수 있게 합니다. 이러한 데이터는 다른 엔티티와 상호 연결된 관계를 가지기 때문입니다. 마지막으로, 관계에서 파생된 패턴은 조직이 데이터의 유용성을 이해하기 위한 분석을 개발하는 데 도움이 됩니다.
정보 관리
KG는 금융 분야에서도 그 적용 가능성이 있습니다. 톰슨 로이터(Thomson Reuters)는 2017년에 첫 번째 지식 그래프를 출시하여 금융 생태계에 대한 포괄적인 뷰를 제공하고 조직이 투자, 목표, 전망을 효율화할 수 있도록 지원했습니다. 그들의 지식 그래프는 조직, 사람, 금융 상품 및 견적, 공급자-고객 문서 및 보고서, 메타데이터 및 분류 체계, 인수합병 거래 등의 정보를 한데 모아 제공합니다. 이를 통해 금융 조직은 이를 연구 프로젝트, 리스크 평가 등의 기초 자료로 활용할 수 있습니다.
내부자 거래
내부자 거래는 두 명 이상의 개인 또는 엔티티 간의 정보 교환과 관련이 있습니다. 내부자 거래 계획을 조사하는 수사관들은 다양한 유형의 데이터를 조사하여 관계와 정보 유출을 찾고, 목표 인물에 도달하려고 합니다. 전통적으로, SEC 및 기타 정부 기관은 전화 통화, 메시지, 이메일 교환 및 오픈 소스 정보를 조사하고 이를 결합하여 새로운 패턴을 찾습니다. 전통적인 방법을 사용하는 것은 이 과정을 복잡하게 만들 수 있습니다. 지식 그래프는 이러한 다양한 데이터 소스를 모두 나타내어 작은 관계에서도 패턴을 인식할 수 있게 하며, 새로운 정보가 도착할 때마다 지속적으로 업데이트됩니다.
toggle
Now we know how to build KG, it would be interesting for you to be a
- Fraud Detection – Representing fraud scenarios in a graphic visual way, which is the core of a knowledge graph, allows financial consultants to identify to extend their machine learning algorithm work to consider even more heterogeneous datasets that might not be directly related to the topic in hand, or reconsider features and variables that traditional machine learning capabilities can ignore. If your machine learning algorithms have determined them as non-fraud, it is most likely that they’re not. For example, the previous model didn’t account for email addresses as a valuable feature in determining fraud. But if two customers have the same email address, that might raise a red flag: they might be the same person. In this case, an email address is related to an entity (customer) connected to another customer through the same email address.
- Data Governance – As various divisions within a financial company generate new data over time, the data differences that occur lead to inconsistent quality and lack of usefulness to the overall organization. Graphs act as a semantic layer, modeling metadata and adding rich descriptive meaning to data elements.
The combined metadata and relationships form a semantic layer that fully describes the meaning of the data and allows for visualization of all the data in their granularity. By visualizing the data, knowledge graphs allow a user to identify duplicate or inconsistent data, as this data will have an interconnected relationship with other entities. Finally, the patterns seen from the relationships can help the organization develop analytics to understand the usability of the data. - Managing Information – KGs also have their applicability in the field of finance. Thomson Reuters launched its first knowledge graph in 2017 to provide a comprehensive view of the financial ecosystem and help organizations streamline their “investments, targets and prospects.”
Their knowledge graph brings together information about organizations, people, instruments and quotes, supplier-customer filings and reports, metadata and taxonomies, M&A deals, etc. It allows financial organizations to use it as a base for research projects, risk assessments, etc. - Insider Trading – involves exchanging information between two or more individuals or entities. Investigators working on insider trading schemes have to go through different types of data looking for relationships and information leaks to reach the desired person. Traditionally, the SEC and other government agencies examine sources such as phone calls, messages, email exchanges, and open-source information and combine them all to find new patterns. As you can imagine, using traditional methods can complicate this process. The Knowledge Graph allows us to represent all of these different data sources, enables pattern recognition even in the smallest of relationships, and is constantly fed with new information as it arrives.
결론 (Conclusion)
오늘의 지식 탐구가 만족스러웠기를 바랍니다. 마지막으로 "장면 그래프(Scene Graph)"라는 개념을 소개하고자 합니다. 장면 그래프는 이미지와 비디오에서 SPO를 추출하는 것으로, 지식 그래프와는 다릅니다. 지식 그래프는 현실 세계의 엔티티와 그들 간의 관계를 표현하며, 일반적으로 사람, 사물, 개념과 같은 구조를 표현하는 데 사용됩니다. 반면, 장면 그래프는 이미지와 비디오(3D 환경)에서 객체, 속성, 그리고 객체 간의 공간적 관계(포함 관계, 근접성, 동작 등)를 나타내는 데 사용됩니다.
오늘 우리는 데이터를 더 지능적이고 스마트하게 만드는 방법을 깊이 살펴보았습니다. 이를 위해 사용한 기술이 바로 지식 그래프입니다. 오늘의 내용을 간단히 요약하자면, 이 글에서 얻어갈 주요 내용은 다음과 같습니다.
- 지식 그래프가 조직 기술의 추가로 인해 일반적인 그래프와 어떻게 다른지
- 온라인 상점의 판매에 대한 비유를 통해 각 조직 기술을 깊이 있게 설명
- 지식 그래프를 구축하는 방법과 실세계에서 그 예시를 찾을 수 있는 곳
- 이미지 및 비디오 데이터를 처리할 때 활용되는 장면 그래프에 대한 추가 정보
toggle
While I hope I have successfully sufficed your craving for knowledge for today, I want to leave you with some parting information. I want to introduce you to something called “Scene Graphs.” A scene graph(SG) differs from KG because SG extracts SPO from images and videos. Knowledge graphs are used to represent real-world entities and their relationships and are used to represent information in a structured format in a general sense. They can represent structures such as people, things, and concepts. Scene graphs, on the other hand, are used to embody objects, attributes, and spatial relationships between objects (containment, proximity, actions, etc.) in images and videos (3D environments).
Thus today, we have looked deeply into making our data more intelligent and smart. The technique that we utilized for the same is Knowledge Graphs. To briefly summarized today’s read, the key takeaways for you in this article would be:
- How Knowledge Graphs differ from normal graphs because of the addition of “organizing techniques.”
- We then looked into each of the organizing techniques in depth, explaining each case with our analogy of online sales of a shop.
- We followed it by building Knowledge Graphs and where we can find them in the real world.
- Finaed with some additional information on Scene Graphs which are leveraged when we come across image and video data.
References:
- Knowledge Graphs Data in Context for Responsive Business – by Jesús Barrasa, Amy E. Hodler, and Jim Webber
- Beginners Guide to Knowledge Graphs and Scene Graphs – by Asad Haider Rizvi
- Knowledge Graph Representational and Applications in AI – by Parishad Behnam Ghader